Do you generate dependency graphs?
Loading last updated info...
Dependency graphs are important because they give you an indication of the coupling between the different components within your application.
A well architected application (ie. one that correctly follows the Onion Architecture) will be easy to maintain because it is loosely coupled.
There are many tools to quickly generate dependency graphs for .NET projects, each with its own pros and cons. However, the best way to create nice, well-structured diagrams is by crafting them yourself using online tools like draw.io. Although this takes more time and requires a deeper understanding of the project, it’s worth the effort when you want to present it to a client.
If you're looking for quick solutions, check out the options below, where we explore different tools for generating dependency graphs.
Option 1 - Visual Studio + ReSharper
The quick way to generate nice and clear dependency graph is by installing ReSharper extension in Visual Studio. Check the official docs about installing ReSharper.
✅ Pros
- Default diagram - Best diagram out of box, everything is nice and clear compared to other options
- Visuality - When you hover on a project, it will highlight all of it's dependencies
- Dependency view - The graph is readable and organized
- Dependency cycle - Enables users to find dependency problems in the project
- Interface - The interaction with the graph feels very smoothly
- Customizability - It has useful menu to select or deselect any project from the graph (when project added or removed it discards all manual adjustments that has been made before)
❌ Cons
- Requires ReSharper - Need to install 3rd party ReSharper extension in Visual Studio
- Performance impact - Some slowdown can be noticed when ReSharper is enabled
- Additional cost - After one-month trial, you will need a license to continue using ReSharper
- Cluttered view - Complex projects require manual layout adjustments to make the graph readable (no advanced layout tools like Visual Studio has)
- Layout - Only Top to Bottom layout
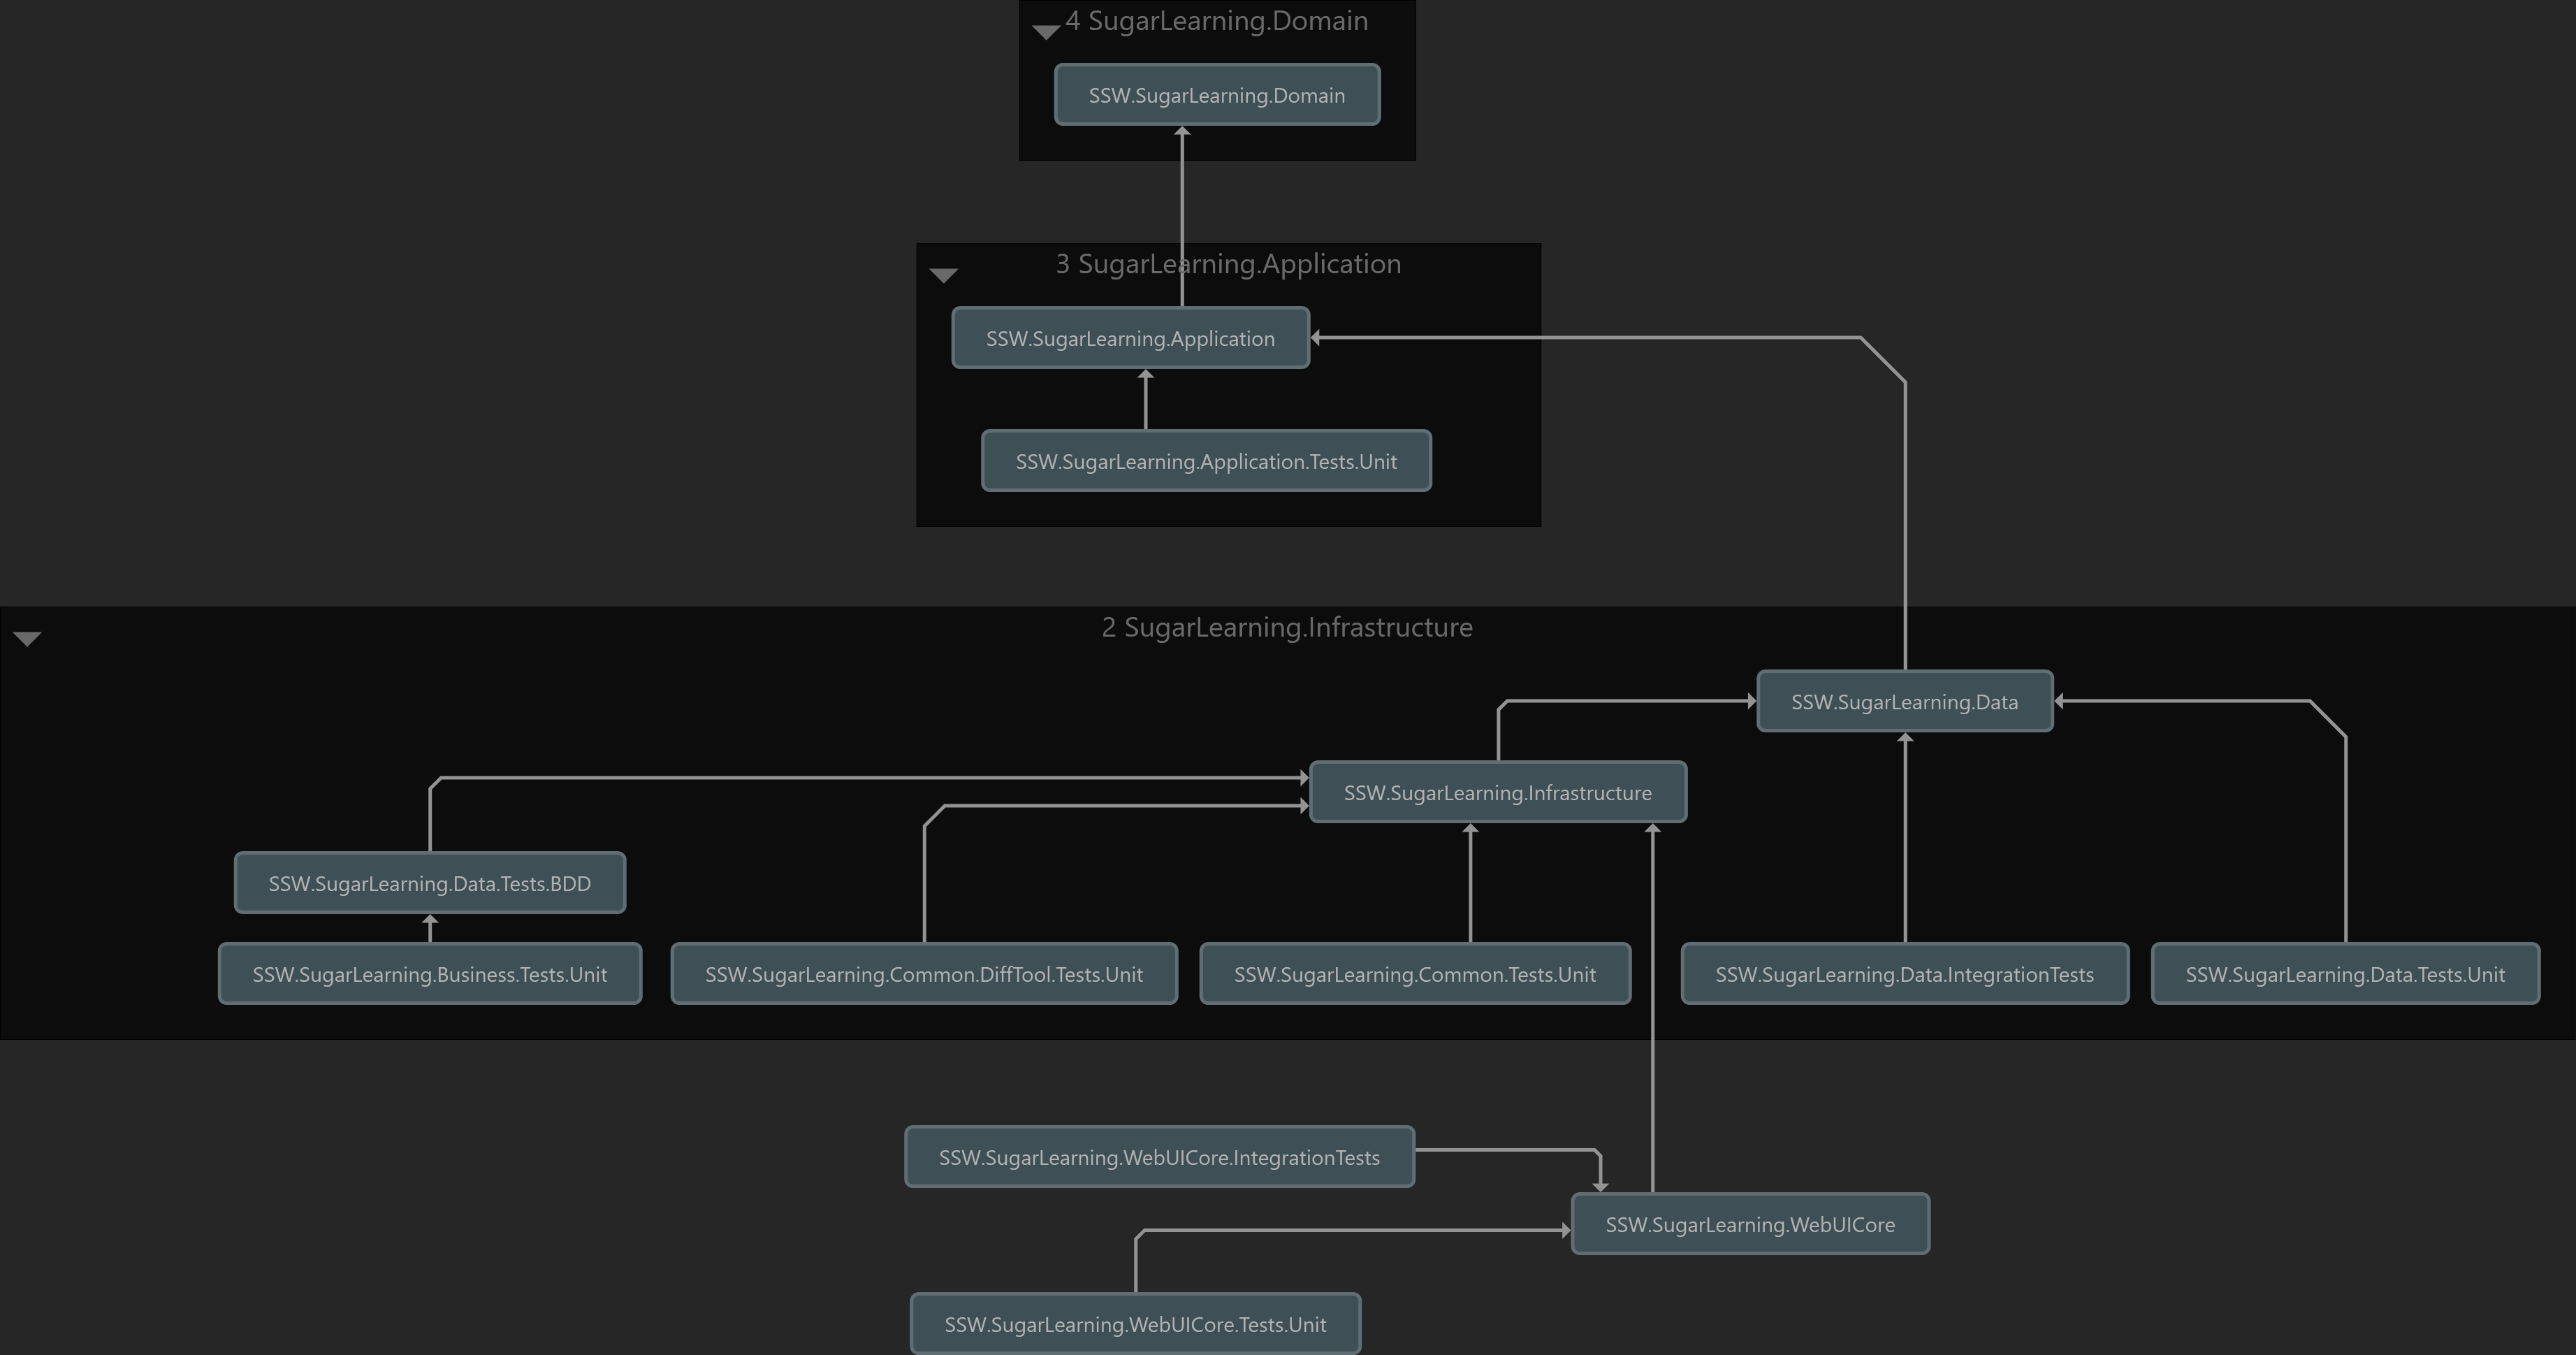
✅ Figure: Good example - The Visual Studio + ReSharper Dependency Graph
Option 2 - Rider
Another option to generate the dependency graph is with the Rider's built-in tool. Check the official docs for more information about dependency graphs in Rider.
✅ Pros
- Dependency view - The graph is readable and organized
- Dependency cycle - Enables users to find dependency problems in the project
- Generation time - The dependency graph generation is very fast
- Customizability - It has useful menu to select or deselect any project from the graph (when project added or removed it discards all manual adjustments that has been made before)
- Availability - You don't require to install any extension into Rider or select any component when you are installing Rider, it is already available in the IDE
❌ Cons
- Dependency arrows - The direction of relationship between projects is not clear when both projects have arrows go in and out.
- Cost - After one-month trial, you will need a license to continue using Rider
- Cluttered view - Complex projects require manual layout adjustments to make the graph readable (no advanced layout tools like Visual Studio has)
- Layout - Only Top to Bottom layout
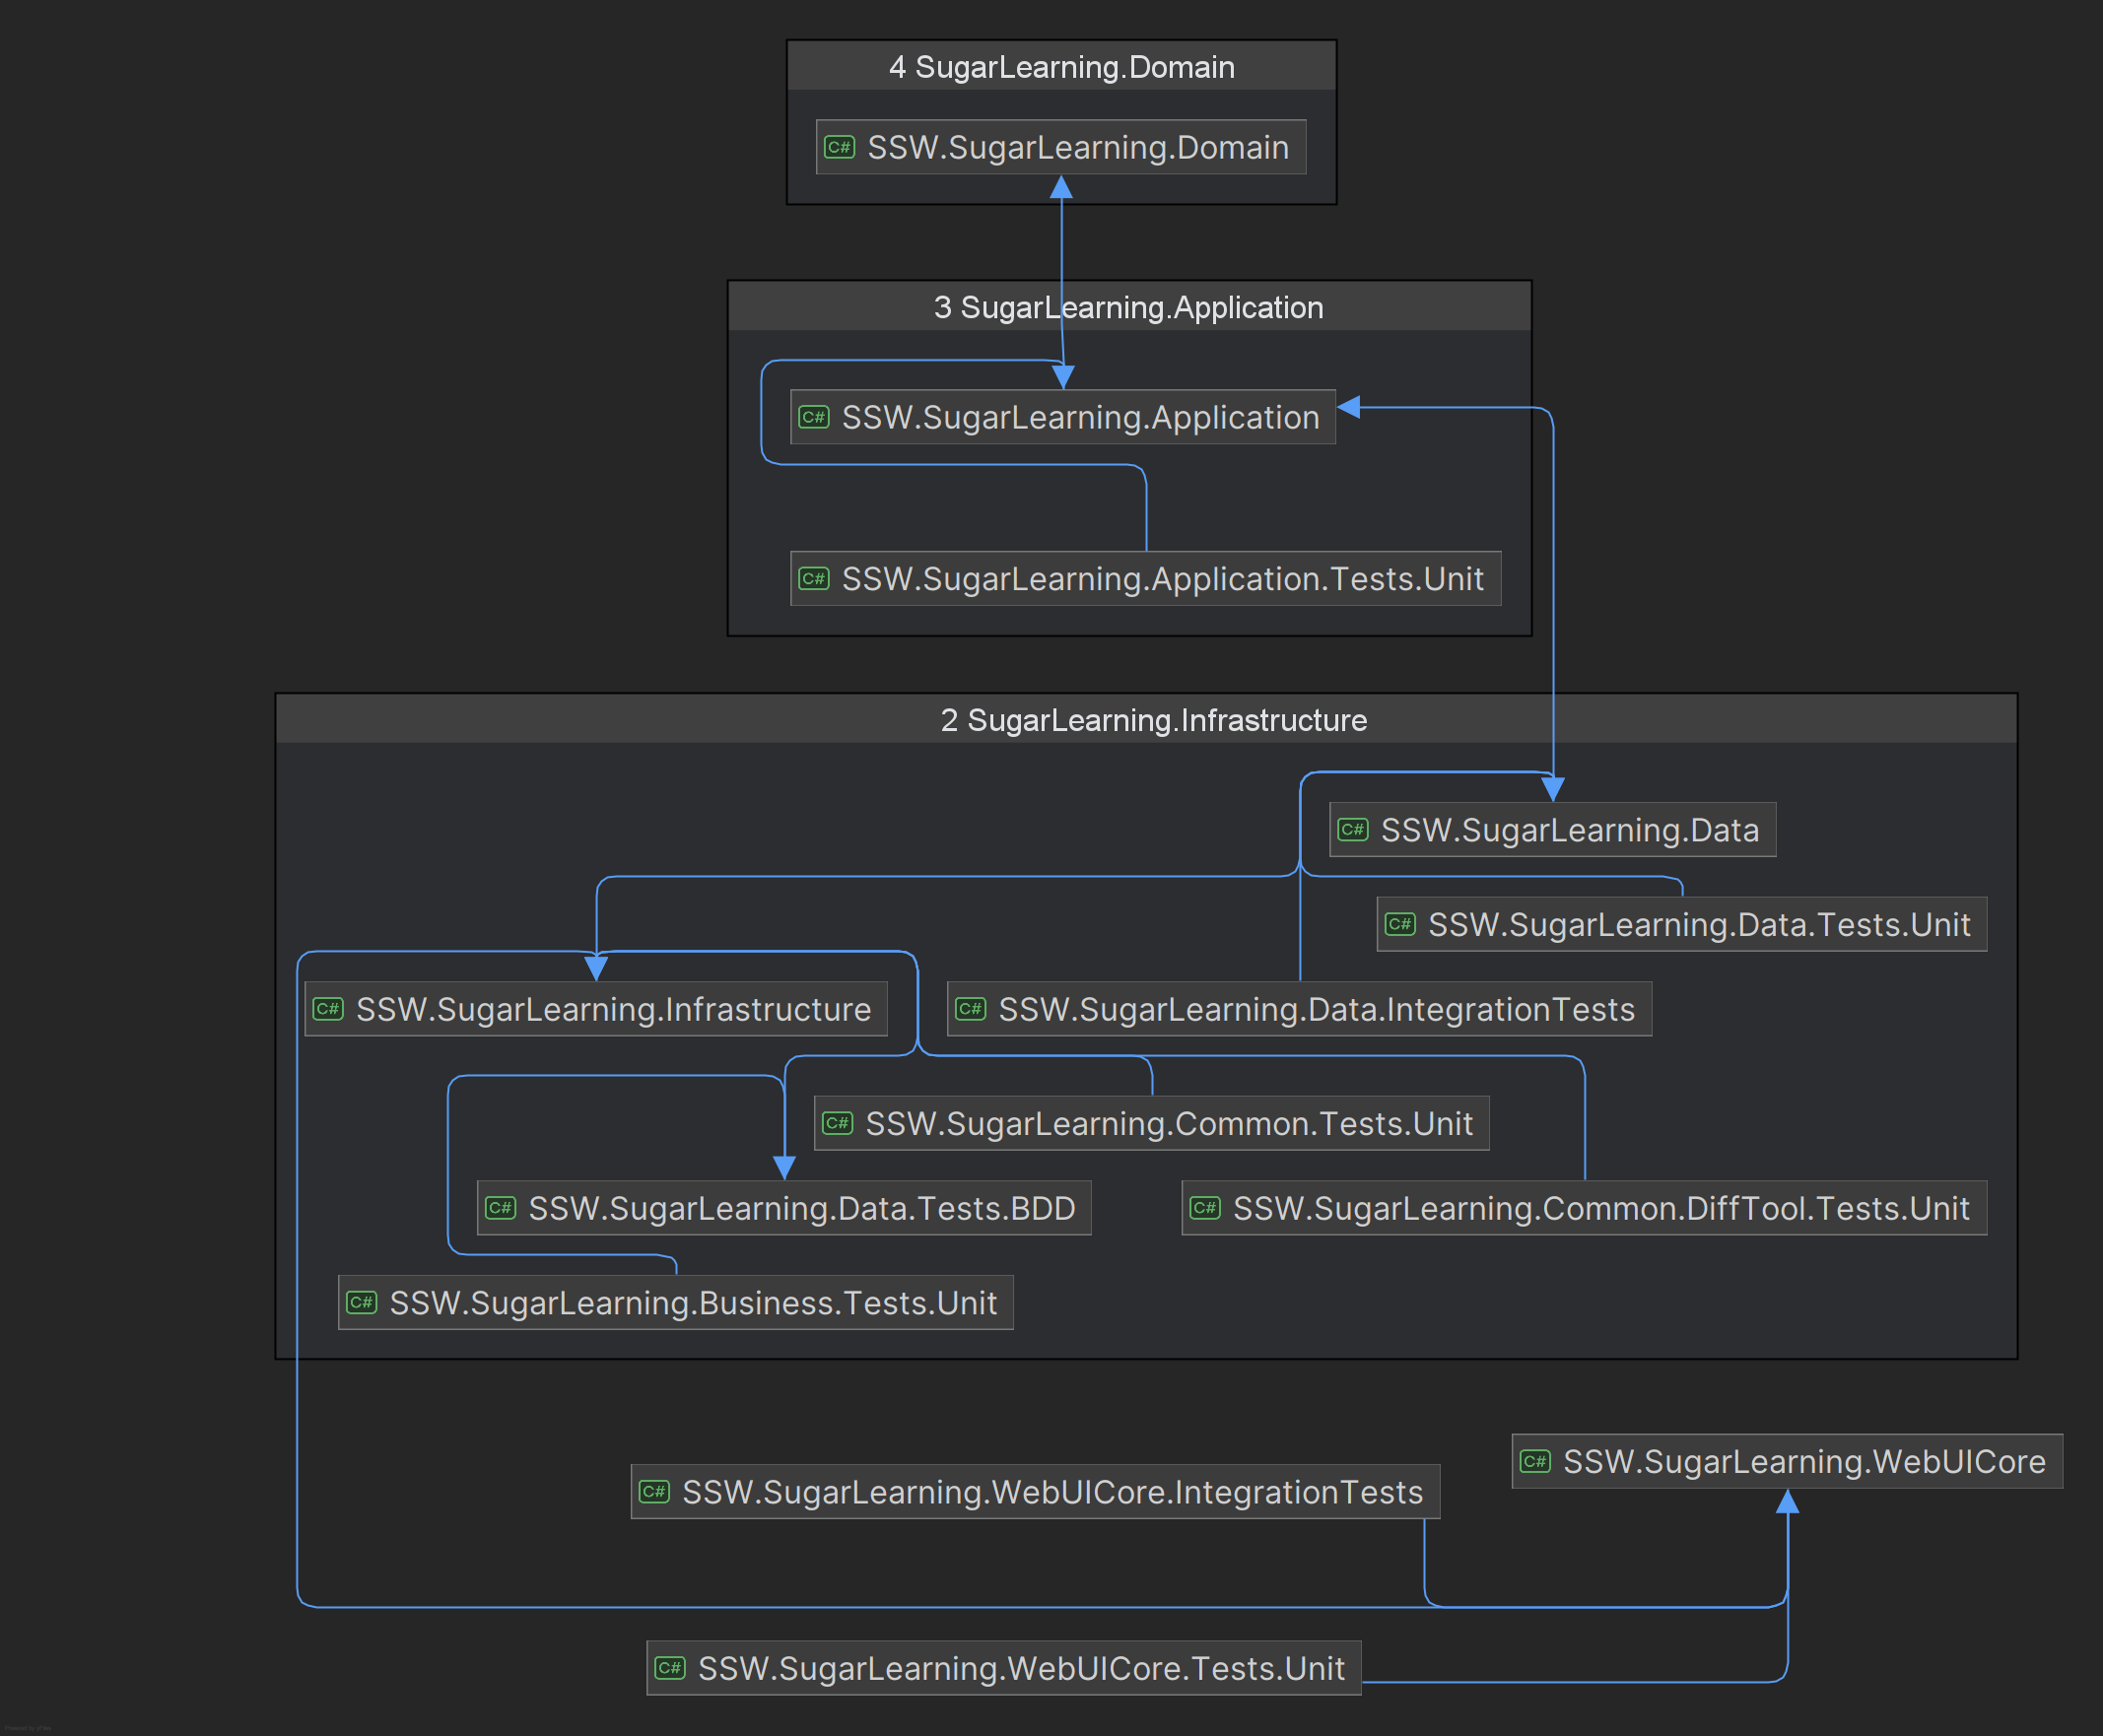
🙂 Figure: OK example- The Rider Dependency Graph
Option 3 - Visual Studio Enterprise
Next option to generate the dependency graph is with Visual Studio, first you need to check if you have installed Code Map and Live Dependency Validation components. Check official docs to learn more about architecture tools in Visual Studio.
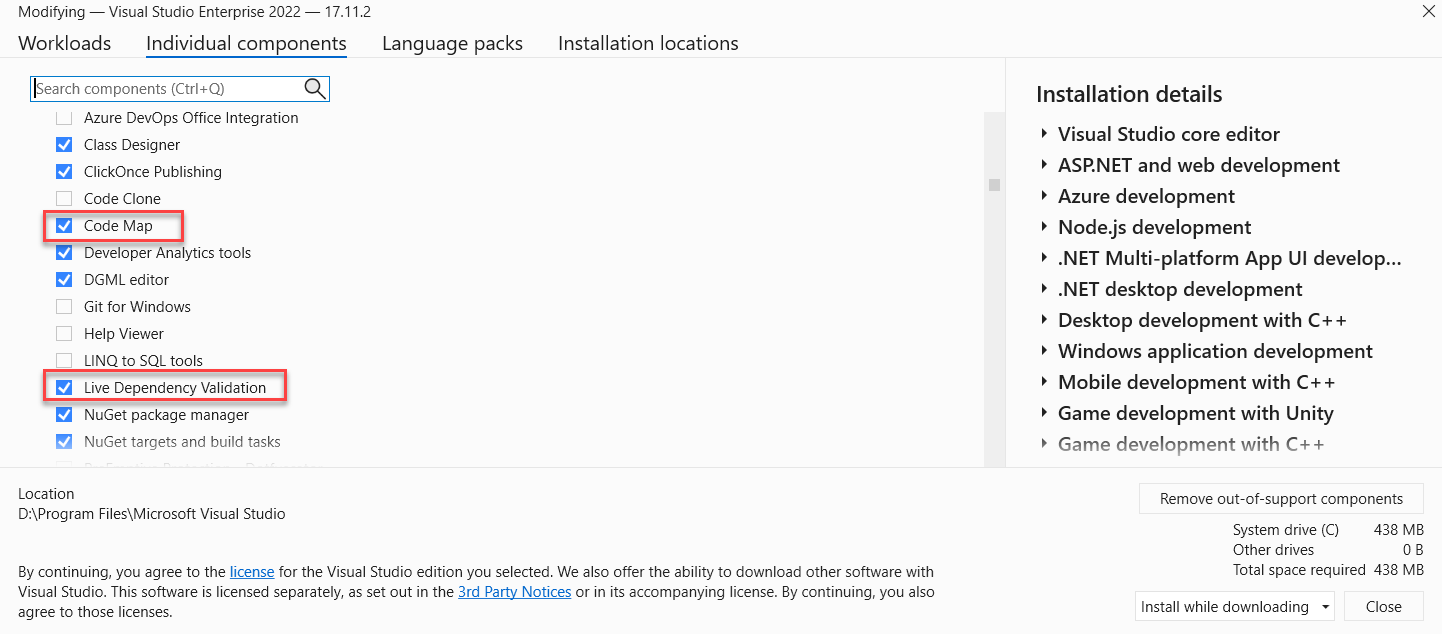
Figure: Your Visual Studio need to have these components installed to be able to use architecture tools
✅ Pros
- Dependency view - Provides high-level view of project dependencies
- Dependency cycle - Enables users to find dependency problems in the project
- Layout - Visual Studio gives different layout options, e.g. Top to Bottom, Quick Clusters, Left to Right, etc.
- Availabilty of graph for everyone - Any Visual Studio edition can read already generated dependency graphs
❌ Cons
- Dependency arrows - Arrows are messy and go into the directory rather than into specific project that makes unclear to see which project it is referencing to
- Interface - Interacting with the graph is slow and not fluid
- Cluttered view - Graph becomes unreadable and confusing for complex projects
- Enterprise edition - Only Visual Studio Enterprise can generate the dependency graph, see official docs for version support
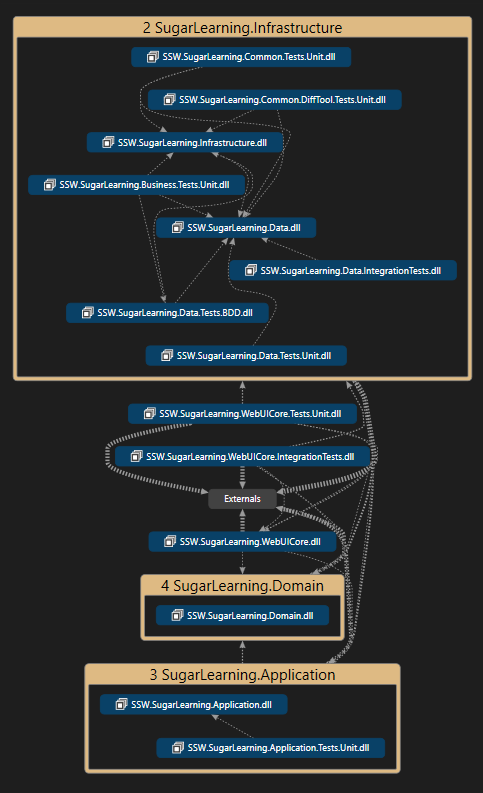
🙂 Figure: OK example- The Visual Studio Dependency Graph
Optional - For very complex (and messy) projects
When project is complex and large, the graphs generated by these tools can be messy and hard to read. In that case you can try nDepend 3rd party solution with the Visual Studio to generate the graph.
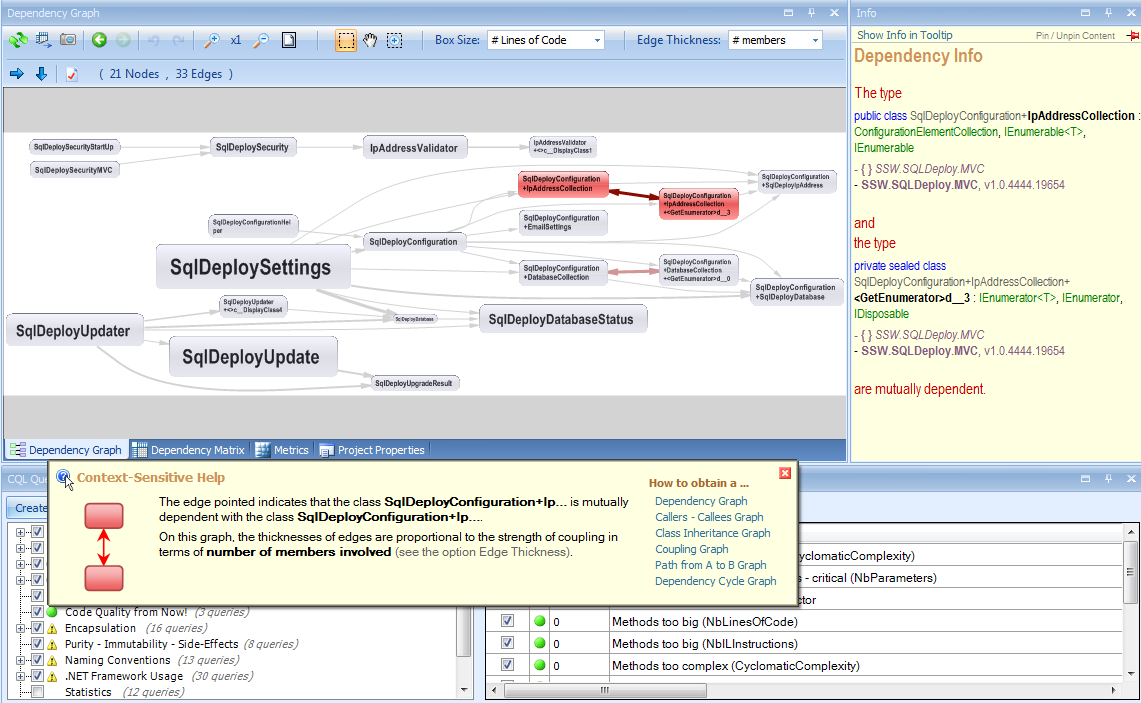
Figure: nDepend Dependency Graph. Issues are highlighted in red for easy discovery