Technical - Do you check your website’s performance regularly?
Loading last updated info...
Page speed remains a critical element for the online user experience. The demand for instant information has made faster loading times more crucial than ever.
Users are less patient, and if a webpage takes too long to load, they are likely to abandon it in frustration. This not only results in a lost visitor but also poses a risk to potential conversions.
Tip: Use this free Google tool named PageSpeed Insights to test your URL.
For a smooth and responsive user experience, your site needs to be checked for performance bottlenecks. These usually become noticeable sometime after deployment, as your user base and quantity of content grows.
This includes checking for improvements on:
- The slowest pages
- The compression of unnecessarily large images
- Slow database queries
- Page responsiveness
A website with large, uncompressed images, excessive plugins, and unoptimized code can lead to slow loading times.
Visitors may encounter delays, increasing the likelihood of frustration and abandonment.
This negatively impacts user experience and potential conversions.
❌ Figure: Bad example - Things that will negatively impact the website UX
On the contrary, a well-optimized website employs techniques such as image compression, efficient coding, and minimal use of plugins.
These optimizations contribute to:
- Faster page loading
- Enhancing user satisfaction
- Increasing the chances of retaining visitors and conversions
✅ Figure: Good example - Good performance will improve the website's UX
Video: Performance - Speeding Up Websites e.g. TinaCMS⚡️ (4 min)
Use the Performance Tab in Chrome DevTools
One of the best ways to identify and fix performance issues is by using the Performance tab in Chrome DevTools.
This powerful tool helps you
- Record and analyze the page load process
- Identify long-running tasks that block the main thread
- Spot inefficient JavaScript execution
- Visualize layout shifts and rendering bottlenecks
How to use it
- Open your website in Google Chrome
- Right-click anywhere on the page and choose Inspect (or press F12)
- Navigate to the Performance tab
- Click Record, then reload the page to capture performance data
- After recording, you'll see metrics like Largest Contentful Paint (LCP), Cumulative Layout Shift (CLS), and other key performance indicators
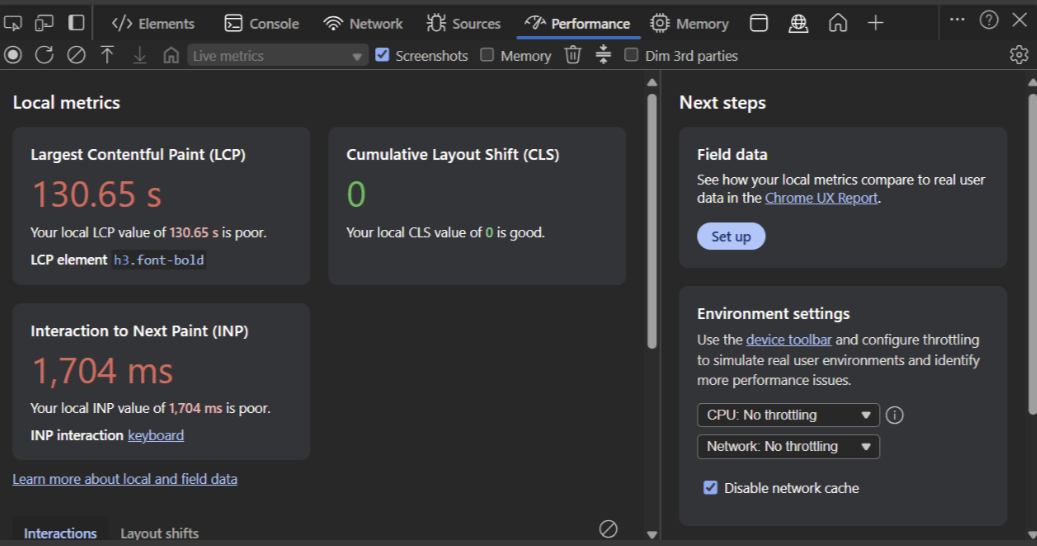
❌ Figure: Bad example - Slow LCP, leading to a poor user experience
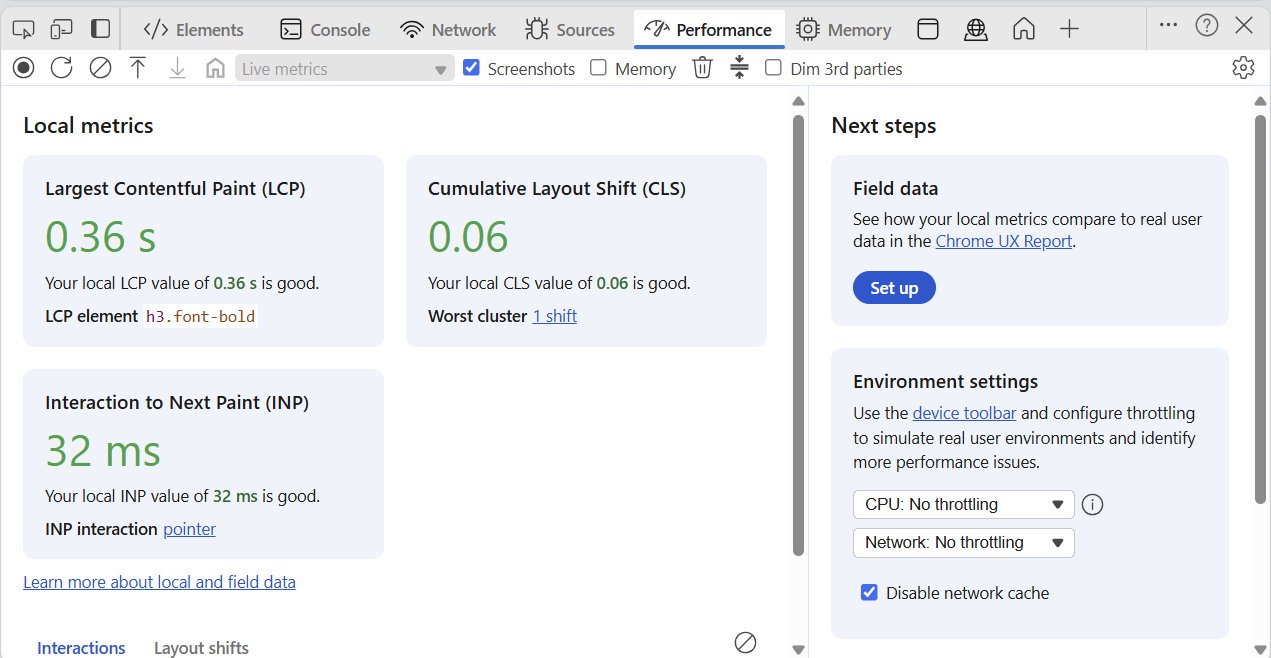
✅ Figure: Good example - Fast LCP shown in Chrome DevTools Performance tab
Use Lighthouse for a Comprehensive Audit
Lighthouse is another powerful tool built into Chrome DevTools that provides a full performance audit of your website. It measures performance, accessibility, best practices, SEO, and more.
To run a Lighthouse report
- Open your site in Google Chrome
- Right-click anywhere on the page and choose Inspect (or press F12)
- Navigate to the Lighthouse tab
- Choose the report type (e.g., Mobile or Desktop)
- Click Analyze page load
This tool gives you a performance score and actionable recommendations to improve your site's speed and user experience.
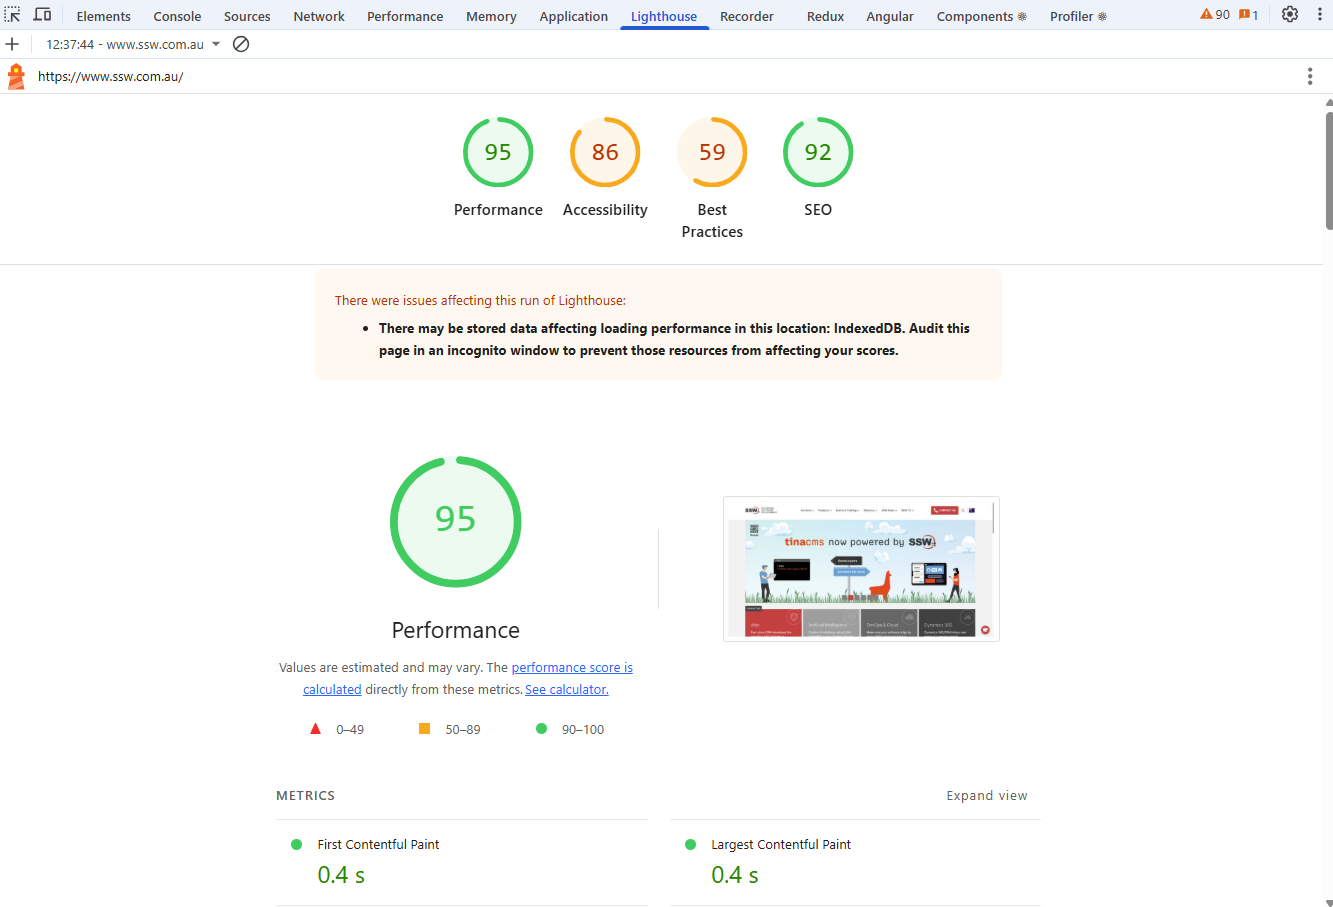
✅ Figure: Good example - Lighthouse audit with high performance and SEO scores, plus actionable insights
Adding Lighthouse into your CI/CD Workflow
To leverage the power of Lighthouse even more, we can implement these checks into our CI/CD workflows so that we can automatically scan a series of routes on all of our pull-requests. This increases the likelihood that negative impacts to your site's performance will be picked up on.
For GitHub, the key aspects of implementing this are:
- A main workflow template (
.github/workflows/template-lighthouse.yml) - a reusable template that runs the lighthouse audits on deployed sites. This template will be auditing and eventually commenting on the pull-request - A workflow that triggers the template - this can be included in any workflow that is run as apart of your CI/CD
- A Lighthouse configuration file (
.lighthouserc.json) - this will configure what aspects of Lighthouse to report on, and allow for selective auditing - A report generator (
generate-lighthouse-report.py) - this will be a Python script that processes Lighthouse results and generates markdown report to be commented
Learn more on Do you compare PR performance with Production before merging?
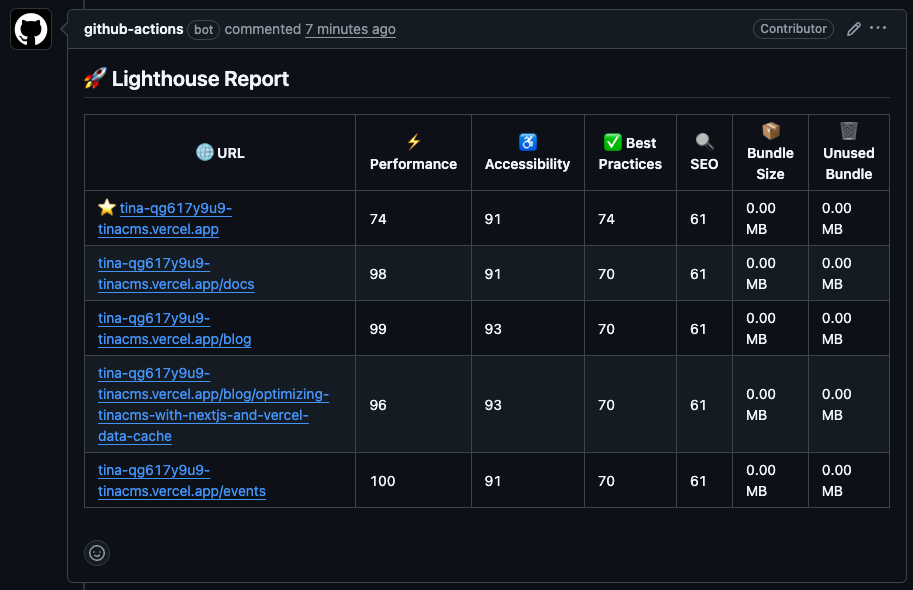
✅ Figure: Good example - Lighthouse Audit in GitHub pull-request